This assessment consists of 4 questions. YOU MUST ANSWER ALL PARTS OF ALL FOUR QUESTIONS.
THE DEADLINE FOR SUBMISSIONS IS
The assessment accounts for 100% of your grade for this course.
Question 1
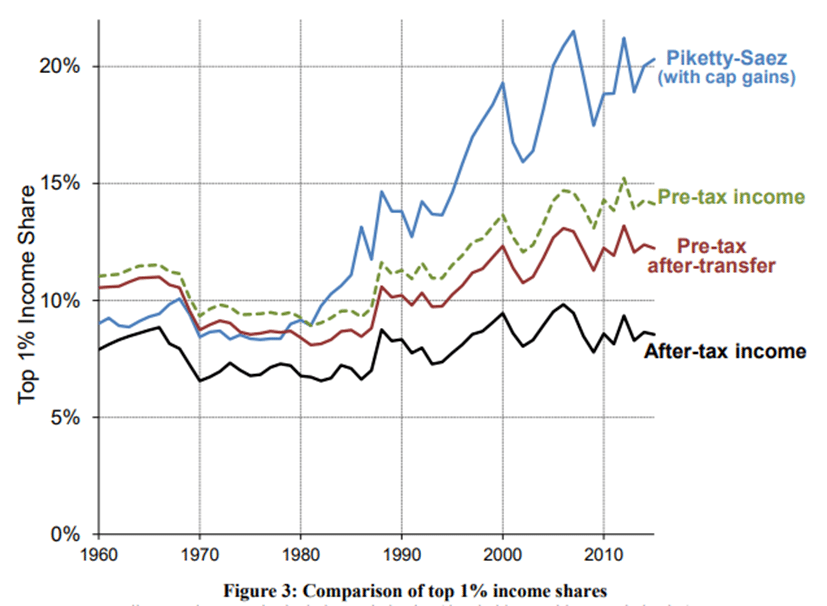
In class, we discussed Thomas Piketty and Emanuel Saez’ seminal paper “Income Inequality in the United States, 1913-1998”, published in the Quarterly Journal of Economics (118(1), 2003, 1-39). The chart below is from a recent academic article by Gerald Auten and David Splinter (2022) (see http://davidsplinter.com/AutenSplinter-Tax_Data_and_Inequality.pdf) that re-analysed the data used in this article.
Judging from this chart, did the re-analysis change the main conclusion? What methodological adjustments are apparent from the chart? Describe other methodological shortcomings in Piketty and Saez (2003) and outline how these shortcomings could be addressed in a re-analysis of the data.
Your answer to Question 1 should be limited to a maximum of 700 words.
Question 2
In 2016, the UK’s minimum wage was increased substantially for workers aged 25+, and renamed the National Living Wage. In subsequent years, the government further increased the ‘bite’ of the National Living Wage – in other words, the NLW increased as a fraction of the median hourly wage.
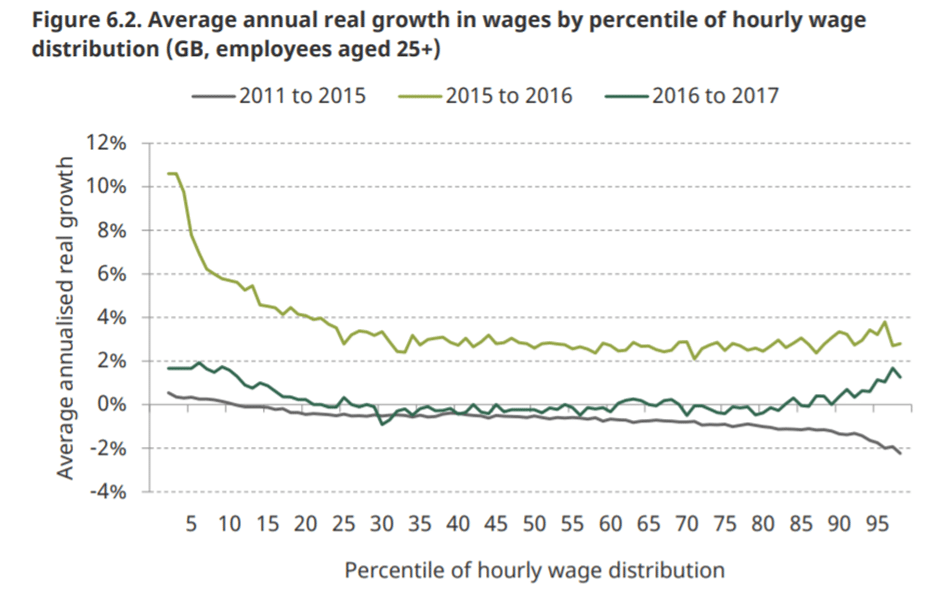
- The chart below shows average annual real wage growth across the hourly wage distribution. Briefly state what the chart suggests happened to the wage distribution between 2015 and 2016, when the NLW was introduced. (Chart source: p. 83 of https://ifs.org.uk/uploads/R145%20for%20web.pdf). One or two paragraphs should suffice for your answer.
- In understanding the implications of the NLW on earnings inequality, what other factors might policy makers be interested in? (hint: think about the distinction between inequality of hourly pay, and inequality of weekly earnings). Your answer need not exceed 100 words.
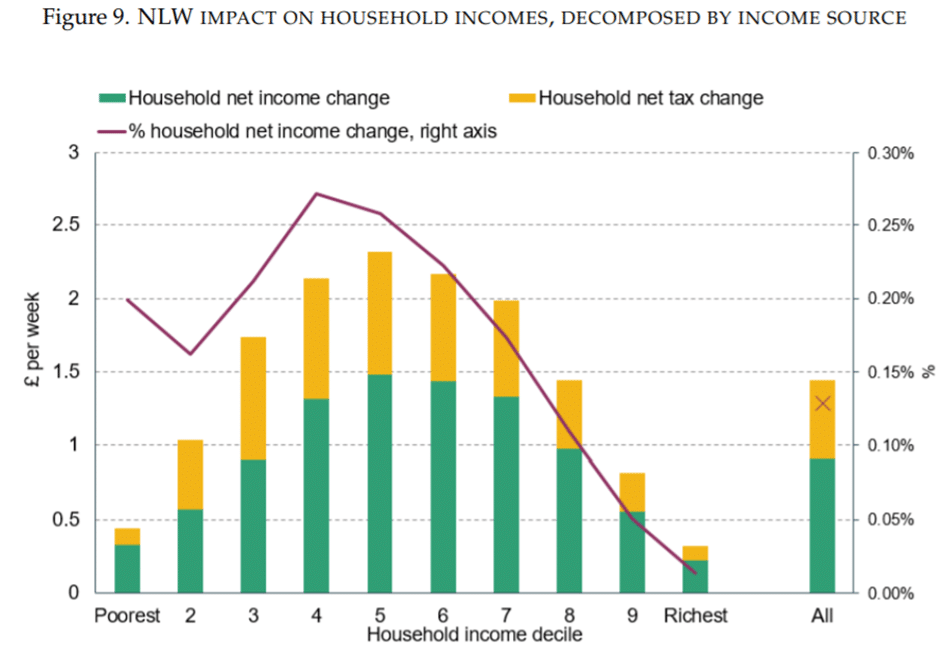
- The chart below provides an estimate of the effects of increases in the NLW on household net incomes. Briefly comment on what the chart tells us about the effect of increases in the NLW on household income inequality. (Chart source: p.30 of https://assets.publishing.service.gov.uk/government/uploads/system/uploads/attachment_data/file/1039374/IFS_WP202148-The-distributional-and-employment-impacts-of-nationwide-Minimum-Wage-changes.pdf) Your answer need not exceed 100 words.
- What factors explain the pattern of results observed in the chart below? Your answer need not exceed 100 words.
- On the basis of your previous answers, how effective do you think further increases in the NLW are likely to be at reducing inequality? What other types of policy might be more effective at reducing household income inequality specifically? Limit your answer to 200 words.
Question 3
Consider the impact of the pandemic, and responses to it, on the skill development of children by assessing the following questions. Draw on material covered in class and on related material you source beyond the class.
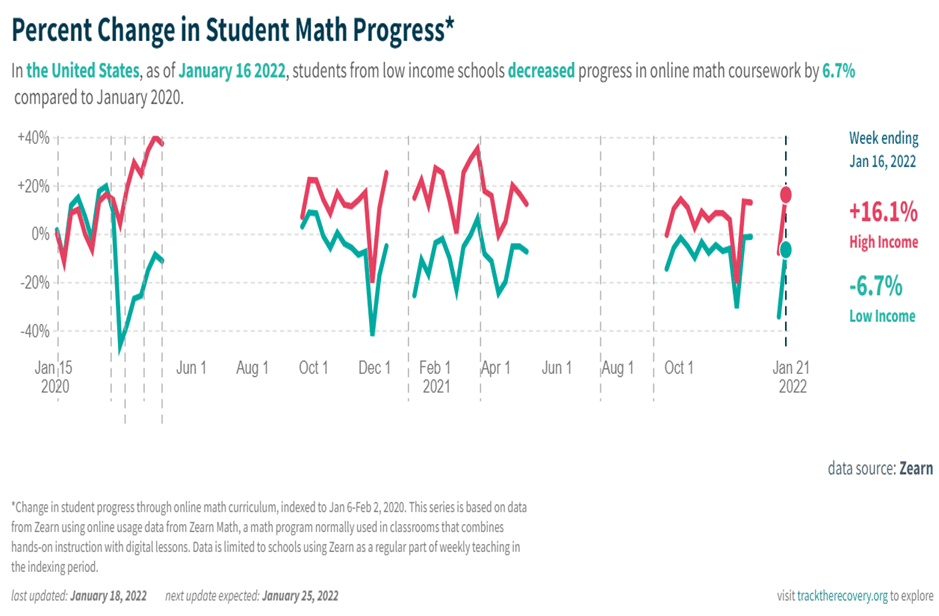
From the Opportunity Insights project we obtain the following graph of student math progress in the US across students from high (in red) and low (in turquoise) income schools.
- Briefly highlight the key descriptive takeaways from this chart.
- Discuss with reference to channels/mechanisms that we discussed in class what may give rise to the observed patterns.
- What econometric concerns around estimating causal effects may be important when attempting to assess whether the proposed mechanisms you just discussed indeed drive these patterns? Your answer here need not be very long.
Your answer to all parts of question 3 should be limited to 700 words.
Question 4
Governments have ambitions to achieve economic growth that is inclusive.
- How might we measure whether growth is inclusive?
- Discuss some challenges that arise when using these measures to track inclusive growth.
Your answer to question 4 should be limited to 700 words, excluding references.
Do you need urgent help with this or a similar assignment? We got you. Simply place your order and leave the rest to our experts.